
Overview of the apartment market of Tallinn and its neighbouring areas (as at the end of December 2016)
The quick growth in the transaction activity and price level in the last years has somewhat receded, but the further growth of the price levels has been retained. Based on the statistical average, the price increase of property on the entire apartment market has not been even; transactions with new developments have stood out both in terms of the transaction activity and their total value.
Increase in transaction acitivty in Q4 could be seen only within Tallinn
In Q4 2016, 2,528 apartment transactions were made in Tallinn, which is by 18% more than in Q3 and by 5.4% more than in the same period in 2015. But in the areas close to Tallinn that are more active on the property market[1] 361 transactions were made in the quarter; this is by 14% more than in Q3 but by 4.0% less than in the same period in 2015. Growth in the transaction number has been much faster in Te Tallinn in the previous years, but further growth in 2016 in the neighbouring areas of Tallinn has stopped.
In terms of the apartment transactions in December, the transaction activity increased similarly to the quarterly data above all in Tallinn; the activity growth in neighbouring areas remained rather modest compared to the emotion purchases characteristic to the Christmas period. In Tallinn 937 transactions were done in December, which was by 19% more than in November and by 3.8% more than in the same month in 2015. In Tallinn’s neighbouring areas 132 transactions were done in December, which is by 1.5% less than in November, but 18% more than in December 2015. In neighbouring areas, the transaction activity has shifted very much, because of the large share of transactions with new developments, but the number of transactions has been on the same level both in November and December.
In Q4, in December, a new peak in price level was attained in Tallinn city
The median square metre price of all transactions with Tallinn apartment ownerships in Q4 2016 was 1,599 €/m2 and the arithmetic average 1,692 €/m2. In the period within the quarter, the price level was rather volatile – from October to December, the median price differed by 8.3% and arithmetic average by 7.2%. The large difference in price level was due to the price levels in December that turned out to be the highest in the Estonian real estate history. Compared to Q3 2016, the median price increased by 0.9% and arithmetic average by 1.4%, thus the share of new developments[2] was still high. Compared to Q4 2015, a 6.4% price increase in median occurred and a 8.7% increase in arithmetic average.
The price dynamics of Tallinn neighbouring areas has largely overlapped with Tallinn city, developing in the same pace as the capital’s market. The median price in neighbouring areas in Q4 2016 was 1,414 €/m2 and arithmetic average 1,337 €/m2, while the price levels increased compared to Q3 by 0.4% and 1.4%. Compared to the same period in 2015, the median price increased by 5.7% and arithmetic average by 5.1%. In terms of Tallinn neighbouring areas, the large share is formed by transactions with new developments, thus quarterly and monthly major regional changes in price levels are more ordinary. The areas are characterised by a constant population growth and high construction activity that supports both the economic and social development of the suburbs of Tallinn, which is reflected in the real estate prices in a longer term.
The arithmetic average of transactions in Tallinn in December was 1,746 €/m2 and median price 1,681 €/m2; compared to November, they increased by 2,8% and 7,3%. Compared to December 2015, arithmetic average increased by 11% and median price by 8,7%. In terms of typical apartments, the transaction activity and price level increase have been much slower than that of new developments. The calculated average price level in December in Tallinn was 1,474 €/m2, which increased by 1,9% from November and by 6,7% from the same period in 2015. Differently from contracts under the law of obligations, the transactions with new developments that had received a usage permit saw a price decrease - compared to November by 2,1% and December 2015 by 3,6%. Thus, price levels and transaction activity increased in December only in case of transactions with totally new apartments.
In terms of December, the arithmetic average of all apartment transactions in neighbouring areas was 1,370 €/m2 and median price 1,461 €/m2. Compared to November, arithmetic average increased by 2,7% and median price by 1,9%. Compared to December 2015, the arithmetic average and median price increased by 11%. Price levels have been kept high mainly by transactions with new developments; major changes in transaction activity or price level are not noticeable in case of apartments with older residential fund.
Transaction activity and price dynamics of Tallinn city and its neighbouring areas
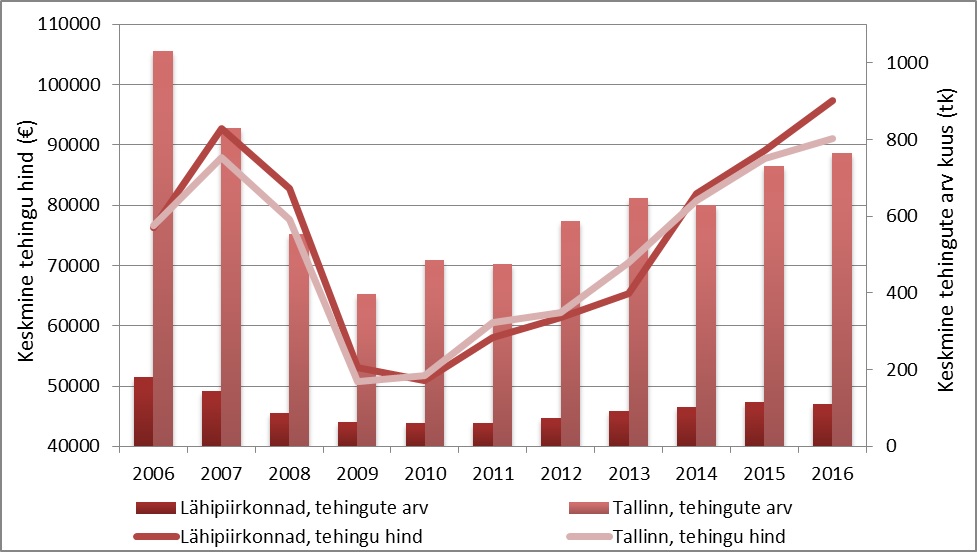
Source: Land Board, transaction database
Tallinn apartment market based on the classification of apartment buildings
The real estate market of Tallinn town as an economic whole is jointly functioning but it is formed by several smaller areas, the price levels of the apartments there differ due to location and the state of building. As follows, the real estate market in Tallinn has been divided into different parts – Tallinn city and its neighbouring areas typical apartments[3] and new developments.
Transaction and price dynamics of typical apartments in Tallinn and its neighbouring areas in Q4 2016
|
Area * |
Calculated average surface unit price (€/m2) |
Calculated average change compared to previous quarter |
Calculated average change compared to the same time last year |
Change in the number of transactions compared to previous quarter |
Change in the number of transactions compared to the same time last year |
|
Haabersti |
1 243 |
-0,1% |
7,3% |
25,0% |
37,9% |
|
Kesklinn |
1 987 |
9,2% |
8,3% |
-1,3% |
-0,6% |
|
Kristiine |
1 514 |
-5,5% |
5,3% |
13,0% |
34,5% |
|
Lasnamäe |
1 276 |
3,0% |
5,5% |
13,9% |
11,5% |
|
Mustamäe |
1 351 |
0,3% |
7,3% |
-3,9% |
-10,2% |
|
Nõmme |
1 455 |
-2,2% |
8,5% |
-25,5% |
-25,5% |
|
North-Tallinn |
1 560 |
4,2% |
14,1% |
-7,7% |
-2,5% |
|
Tallinn as a whole |
1 450 |
2,0% |
7,3% |
3,6% |
4,3% |
|
Neighbouring areas as a whole |
1 034 |
14,0% |
9,1% |
-23,0% |
-11,0% |
* Pirita district has not been indicated due to the little regional occurrence of typical apartments
Source: Land Board, transaction database
Typical apartments are located in Tallinn above all in areas such as Lasnamäe, Mustamäe, Kristiine and Haabersti. The apartments have central heating and are located mainly in 5-9-floor apartment buildings built in 1940-1990. There are the least such apartments in Nõmme and above all in Pirita district. Outside of Tallinn, Maardu town is the typical apartment market in areas close to Tallinn.
Q4 2016 was characterised by some increase in transaction activity and price level on Tallinn typical apartment market compared to the previous quarter. The increase in the number of transactions and higher prices indicate that the price increase has continued also for typical apartments, not only new developments. Despite the clear growth, the growth in the statistical indicators of typical apartments has somewhat slowed down in the last period, thus the typical apartment market can be interpreted as stable.
Similarly to Tallinn, the price levels of the typical apartments in Tallinn neighbouring areas increased in Q4 2016, while the transaction activity decreased significantly. The growth in the statistical price level in neighbouring areas deduced from the transactions in Saue municipality, where the price level increased more compared to other areas. Based on the data of typical apartments in Maardu town, in terms of price level and transaction activity, the price level and number of transactions have increased more than in Tallinn.
Transaction number and price dynamics of the new developments in Tallinn town and its neighbouring areas in Q4 2016
|
Area |
Calculated average surface unit price (€/m2) |
Calculated average change compared to previous quarter |
Calculated average change compared to the same time last year |
Change in the number of transactions compared to previous quarter |
Change in the number of transactions compared to the same time last year |
|
Tallinn as a whole |
1 780 |
-3,4% |
-4,1% |
-23,2% |
-53,6% |
|
Neighbouring areas as a whole |
1 475 |
-1,1% |
2,8% |
-12,4% |
-34,5% |
Source: Land Board
The majority of residential fund in Estonia has been built before the 1990s and the following part after the 2000s, thus a new development market segment can be distinguished based on building, plan and quality; this is reflected mainly in the different price level. Within Tallinn most transactions with new developments are made with apartments that are located in apartment buildings built in 2011-2016, but in Tallinn neighbouring areas with apartments between 2001 and 2010.
Differently from the growth in the apartment transaction volume of new developments, both the price level and transaction activity of the new developments that received a usage permit declined in Q4 2016. This trend has been seen also in previous quarters, thus it can be estimated that people who purchase new developments prefer brand new apartments to the ones that have been ready-built. The share of new development transactions with real right contracts and contracts under the law of obligations has been constantly increasing; in Q4 2016, the new developments formed about 30% of the total share of apartment transactions.
In Q4 2016, the number of transactions with new developments that had already received usage permit remained in a decline also in Tallinn neighbouring areas, but differently from Tallinn, the price level increased compared to previous year. New development prices have increased the most in Rae and Viimsi municipality, where most transactions are also conducted. Transactions have decreased significantly in Saue and Saku municipality, because the property that was previously on sale has been largely sold. Changes in both transaction activity and price levels deduce from the single larger development projects in neighbouring areas, the influence of which is rather wide on the regional statistical indicators.
Demand and offer dynamics
Real estate prices have grown significantly in the last years, twice as faster in Tallinn than the transaction activity. Customers purchasing a dwelling have become more calculating in their decisions due to the wide selection, but extension of the sales period is not noticeable. According to Arco Vara, there are sufficient offers on the market to satisfy the existing demand. Based on Arco Vara statistics of 2016, the average sales period of apartments in Tallinn and its neighbouring areas was 206 days, or about 7 months.
Customers have started to prefer areas close to the city – because surface unit prices are cheaper and when buying a dwelling to these areas, it is more than just a dwelling. Projects are preferred that besides the general construction quality and price can offer a complete social economic environment and a living environment close to nature. In terms of new developments, market situation is regionally different – in the center, apartments with less rooms are preferred and further away from city, 3- and 4-room apartments. Based on Q4 data, transaction activity in Tallinn neighbouring areas is decreasing.
In the last years, price and transaction activity have increased but also the number of offers. In Q3 2016, based on the portal www.kv.ee, the increase in the number of apartment offers in Harjumaa had stopped. Decrease in offers continued also in Q4, on a monthly basis compared to previous months by about 2% a month. In 2016, the number of offers decreased by 2,5%, based on which offer-based prices increased by 4,6%. Despite the fact that offers have increased in terms of years, decrease cannot be noted in price level change, but the level of the number of offers is certainly stopping the increase in price level.
When focussing on new developments coming to the market in the future, 3-5-floor and 6-8-floor apartment buildings are expected to be finished. The number of issued building permits was the highest of the last years in 2015, while the same capacity of issued permits is expected also in 2016. However, real construction activity is started in case of less fewer projects, thus some of the developments remain not realised or the works are conducted later when the local municipality has been informed of the works. Based on the data of construction and usage permits, construction activity will stop in the near future.
When looking at the surface structure of buildings, the average surface is growing in case of apartments in 1-2-floor apartment buildings. Developers have started to fulfil consumer expectations in case of the apartments – customers prefer more spacious and bigger apartments in smaller apartment buildings. The average surfaces of apartments in 3-5-floor apartment buildings are decreasing, this is mainly due to the prerequisite that square metre prices of smaller apartments are more expensive and smaller apartments are also more marketable since the apartments are easier to buy due to their smaller size.
Offer and construction dynamics of dwellings in apartment buildings in Harjumaa
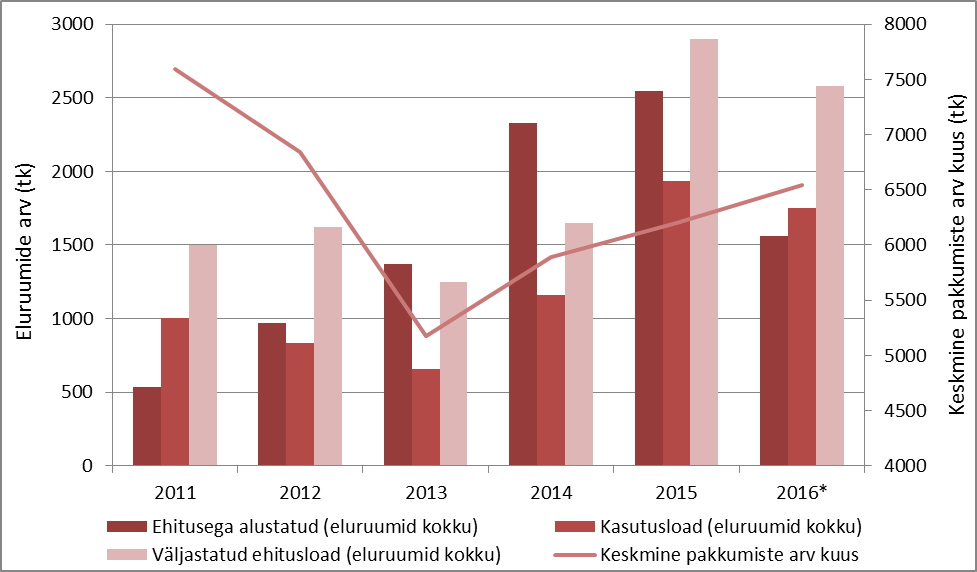
* as of Q3 2016
Source: Statistics Estonia, KV.ee
Forecasts
Following the financial crisis of 2008, the prices of residential property have been increasing in Tallinn and its neighbouring areas since the second half of 2009. When economic confidence started to be regained in 2013 and 2014, the demand for new residential surface started to increase significantly, thus the price increase was much faster. By now, the price levels of Tallinn and its neighbouring areas have reached the top level years ago, but this can be still considered an event of statistical and historical importance without taking into account the inflation.
Because of the growing offers related to the constant new developments on the market the number of transactions and price levels has increased within Tallinn. By the start of 2017, the level of number of offers had attained the same level as in the same time in 2016. Competition between developers has created a situation where the current price increase of apartments has somewhat slowed down. The quick decrease in the number of offers can create a new situation in which suitable development plots are too expensive for developers which will promote further price increase in Tallinn or move the developments to its neighbouring areas. The latter is more probable, since based on the criteria of applying for residential loan, apartments’ transaction prices cannot grow forever. A growth in orders in the private sector is not estimated in the near future by major Estonian construction companies either.
The selection of development projects is rather wide, thus longer sales period and lower purchase interest are noticeable in case of objects with worse quality and location. However, major risks are not expected since in case of low interest rates existing loans can be re-financed easier, pay higher interest rates or stop construction works until suitable market conditions. In terms of development project loans, the interest rates are much lower compared to the boom period. Thus, the elasticity of offer and demand dynamics cannot form quickly, thus the period of decline can be quite flexible and stable.
The savings and investments of Estonians have increased rather well so far, thus investments on the rental market have been primarily done. New development apartments have moved to the rental market, which could shape the quality of Tallinn rental market and the relation to price level. Due to massive investment activity older secondary market apartments could retain their price level well, despite the fact that investors with a larger profile have not updated their portfolio due to the decrease in productivity related to increasing prices. A growth in the productivity of rental apartments cannot be forecasted for the near future; due to the new developments added to the market the statistical rental price could increase but the inflation and interest rates are still on a low level. Investments with low risk are smaller apartments (kitchen rooms, furnished rooms, rental houses etc) that retain demand and the price level in terms of rental prices. There is constant demand for cheap, small and functional rental surfaces in Tallinn similarly to many large cities, which is supported by constant growth in the population in Tallinn and Tallinn neighbouring areas.
In the next year, inflation is expected to continue increasing and the current growth in wage increase is expected to quickly slow down, thus some decrease in property transactions can be expected. Due to decreasing transaction activity, sales periods will be somewhat longer; to reach a transaction the sales professionalism of real estate bureaus will start to have a larger role. Stop in the number of Transactions is expected in a longer run also due to the smaller migration to Harjumaa and Tallinn. The growth pace of the loan residue has been slower due to wage increase; thus, wish to decrease loans and high financing from own sources will be likely retained.
Most loans will be applied by people between 26 and 30. Most loans have been applied by 30-year-olds, thus the new development market is mainly focussed on purchasers between 30 and 40. The households that earn up to 1,500 € a month will still purchase typical apartments, while households that earn more than 1,500 € will mainly buy apartments built in 2000-2016. New apartments are mainly purchased by households that earn more than 2,000 € a month; residents with higher income are interested in properties in older rental apartments.
In the near future, a rather stable market is expected, where transaction activity and price level could be shaped by international events. Estonian banking is mainly influenced by events on the Swedish real estate market, since about 72% of Estonian private persons’ loans are related to Swedish banks. When the growth phase of Swedish real estate market turns, resources might be invested to the stabilisation of the domestic market, thus the financing criteria of Estonian real estate purchases might somewhat change. Besides the events related to Estonian loan market, attention could be also turned to the European Union banks and the economic events related to the member states.
Apartment market forecast for Tallinn and its neighbouring areas for the next half year
|
Offer prices |
Prices of purchase-sale transactions |
Purchase-sale transaction activity |
Rental prices |
Rental market activity |
|
general: ↔ secondary market: ↔ new developments: ↔ |
general: ↔ secondary market: ↔ new developments: ↔ |
↓ offers: ↑ demand: ↓ |
↔ |
↑ offers: ↑ demand: ↑ |
In Q1 2017, annual cooling down of the real estate market is expected that is accompanied by seasonally decreasing number of transactions and some decrease in the price level. In January 2016, the number of transactions in Tallinn decreased by 39% and median price by 6,4% compared to the previous month. The declining offers in the second half of 2016 can expect some additions as for new developments. The wide number of new developments will be inhibited by a fast growth of price level and in terms of new developments and secondary market offers, based on offer and real transaction price. Price levels have significantly grown, thus it is a perfect time for people to purchase a dwelling – the market includes very diverse offers, which are mainly formed by residential surfaces with high construction quality.
[1] Tallinn neighboruing areas are the surrounding areas of Tallinn that are most active as for transactions – these areas are Harku, Saue, Saku, Rae, Viimsi municipalities and Maardu town.
[2] New developments are the apartments that are located in apartment buildings, the first usage year of which is in 2001-2017.
[3] Typical apartments indicate the apartments that are located in apartmnet ownerships, the first usage year of which is in (before) 1939 - 2000

